|
Corresponding author: Akbar Abbasi ( akbar.abbasi@kyrenia.edu.tr ) Academic editor: Yury Korovin
© 2019 Akbar Abbasi, Fahreddin Sadikoglu.
This is an open access article distributed under the terms of the CC0 Public Domain Dedication.
Citation:
Abbasi A, Sadikoglu F (2019) Application of soft computing techniques in WWER nuclear power plant safety. Nuclear Energy and Technology 5(2): 177-182. https://doi.org/10.3897/nucet.5.34590
|
Abstract
Nowadays, Nuclear Power Plant (NPP) is one of the intended energy resources for the world requirement energy in future, and nuclear power plants provided 11 percent of the world’s electricity production in 2014. Meanwhile, nuclear power plant safety has always been one of the most critical issues in the world. In this paper, the nuclear power plant safety improvement using Soft Computing Techniques were analyzed. For this purpose, the support system based on Neuro-Fuzzy Diagnosis System (NFDs) method and Genetic Algorithms (GAs) approach were used. The obtained result showed that the first symptom is P3 (pressurizer pressure) and second order symptom is P2 (core coolant average temperature) in both approaches. The comparison between the NFDs method and the GAs approaches indicated that the GAs in data test results was faster than the NFDs results.
Keywords
Nuclear Power Plant (NPP), Soft Computing, Neuro Fuzzy Diagnosis System (NFDs), Genetic Algorithms (GAs), Safety
1. Introduction
Nuclear Power Plants (NPP) are the world’s energy resources, along with hazardous radioactive material, that incident not only limited to a specific location but also cover an extensive range. One of the most critical issues in designing, manufacturing and operating time of NPP’s is the safety system. So, updating and improving the safety of nuclear power plants is one of the most critical issues in the safety of Nuclear Reactors (NR). Also, there is an always incremental demand for operating NPPs more cost-effectively with a high capacity factor. To improve the capacity factors, safety, and prophylactic actions are suitable to deal with potential accidents in NPPs.
Moreover, more cost-effectively with a high capacity factor increase the needs of techniques for diagnosing and prognosis the NPPs defect. In generality, prognostic is an essential issue in Reliability, Availability, Maintainability, and Safety (RAMS). The primary aim of a prognostic system is to demonstrate whether the Structure, System or Component (SSC) of interest can perform its function throughout its lifetime with rational assurance and, vice versa, to evaluation the Remaining Useful Life (RUL) (
Computer programs and computer-based diagnostic systems were widely studied area to support NPP operators during abnormal conditions (
Classification approach is based on process data or expert knowledge about the system and its misbehavior. Relevant symptoms are detected to be representative of each type of failure. The symptoms and faults have a relation that obtained by supervised learning when faults are known a priori, for example in this situation the system decision is tuned to correspond to the right answer from a training set of known examples by an expert. The diagnostic system is an arranger that must then identify; the actual situation represented by a new symptom vector and associates it to one of the known faults, in real time. The neural networks are one of the possible classifiers for non-linear classification and learning (
WWER-1000 is a Russian type of a pressurized water reactor (PWR). The main difference between the PWR and WWER is related to the design of the fuel assembly and the core geometry. The WWER-1000 reactor produces 3000 MWth in maximum power which is generated from 163 hexagonal fuel assemblies (
The Neuro-Fuzzy Diagnosis System (NFDs) method and Genetic Algorithms (GAs) method is validated with NPP safety. In this research, we focus on the area of abrupt faults similar by Neuro-Fuzzy Diagnosis System and Genetic Algorithms methods that most of them occurring at WWER reactor. Abrupt faults are injected into a nonlinear WWER simulator developed by MATLAB SIMULINK environment.
The rest of the paper is organized as follows. Section 2 introduces the fuzzy diagnostic and Genetic Algorithms methods. In this part, the theoretical aspects of the Neuro-Fuzzy Diagnosis System and Genetic Algorithms for Fault Detection are presented. Also, in this section, a vital fault scenario in WWER reactor are supposed. Section 3 describes the results and discussion due to the assumed scenario. Finally, the conclusions are drawn in Section 4.
Nomenclature
NPP Nuclear Power Plants
NR Nuclear Reactors
NPR Nuclear Power Reactor
RAMS Reliability, Availability, Maintainability and Safety Structure
SSC Structure, System or Component
RUL Remaining Useful Life
DS Diagnostic System
FDD Fault detection and diagnosis
MS MATLAB SIMULINK
NFDs Neuro-Fuzzy Diagnosis System
GAs Genetic Algorithms
WWER Water-Water Energetic Reactor (A Russian type nuclear reactor)
ɛ(t) Error in output
J(t) Error function in t time
LPSI Low-pressure safety injection
HPSI High-pressure safety injection
GA Genetic Algorithms
SO Selection Operator
CO Crossover Operator
MO Mutation Operator
PWR Pressurized Water Reactor
Tave Core coolant average temperature
Pp Pressurizer pressure
Lp Pressurizer water level
PSG Steam generator pressure
Wstm Steam generator steam flow
Lsg Steam generator water level
Lcr Condensate receiver water level
Pfw Feedwater pressure
Wfw Feedwater flow
Tfw Feedwater temperature
MATLAB MATrix LABoratory
UP Upper Plenum
PCT Peak Cladding Temperature
2. Methodology
In this section, we introduce the Neuro-Fuzzy method and Genetic Algorithms (GA) approach in technical point of view. Also, the WWER power plant with a critical parameter is presented in the subsection. MATLAB environment is used to implement both Neuro-fuzzy and genetic algorithm techniques. In this framework, the fault and alarm design system of WWER-NPP have been employed.
2.1 Neuro-Fuzzy system
A neuro-fuzzy system is a fuzzy logic system equipped with a training algorithm. The fuzzy logic system is constructed from a collection of fuzzy if-then rules, and the training algorithm adjusts the parameters of the fuzzy logic system based on numerical information (mainly input-output pairs). The structures of neuro-fuzzy systems include numerical information and linguistic. Indeed, the fuzzy logic systems are made from fuzzy if-then rules. Nevertheless, numerical information is combined by training the fuzzy logic system to match the input-output pairs (
A neuro-fuzzy system consists of the following components: neural inputs, neural outputs, neural networks, fuzzy inference, learning algorithm, knowledge base, and decisions. The input data is processed in neural networks where the training algorithm and input data are adjusted. The neural outputs resulted in neural networks is evaluated by the fuzzy inference section. In this section, the output data and knowledge base are interacting. There are two main types of fuzzy inference methods known in the literature: Mamdani and Takagi-Sugeno. Generally, Takagi-Sugeno structures are frequently used if knowledge can be extracted from raw data and Mamdani systems are preferred when knowledge is given by human experts in the form of linguistic expressions (
All of the Nuclear Power Reactors has strict alarming and FDS system. This system supported by multi-level alarm and fault diagnosis techniques. Also, each part of NPP has its own DS section as NFDS can evaluate the control system of the NPP unit. Also, all parts of the NPP can be tested by a pattern recognition NFDS approach (

2.2 Genetic algorithm method
The concept of GA is obtained from the fact that its operations are based on the mechanics of genetic adaptation in biological systems. The efficiency of the genetic algorithm has been proven in many respects such as nuclear power plant safety and fuel loading (Wang et al. 2007,
 , (1)
, (1)
Applying of fitness values, the GA would then evolve a new population for the network to try. After several generations, a population of several “good” structures with parameters evolves, and fittest topology and parameters are used as the best construction of the neural network. A flow chart of GA is shown in Fig.
As seen in the flowchart diagram, after an initial population of chromosomes is randomly generated, then the typical genetic algorithm evolves the population through the following three operators.

Selection Operator (SO), Crossover Operator (CO), Mutation Operator (MO).
The SO section: This section selects individuals (chromosomes) in the population for reproduction.
The CO section: In the crossover section randomly chooses a crossover site along the bit strings and exchanges the subsequences before and after that crossover site between the two individuals to create two offspring.
The MO section: This portion is the new individuals that will have some of their bits flipped (
2.3 WWER nuclear power reactor fault scenario
WWER is a Russian type of a pressurised water reactor (PWR) that it is an intricate system which has many variables influencing its dynamic behavior. WWER reactors contain 17 critical points, and we select one of them Loss of Coolant Accident (LOCA) that significant fault in the reactor. Those critical points need to individual fault diagnosis system. Some essential recommendations have been proposed including the passive safety of nuclear reactors. There are some essential factors for future reactor designs as following (
- The reactor should be inherently safe and not in need of external safety systems. For example, in the emergency of the reactor operators can withdraw all control rods and simultaneously stop all coolant flow, without any adverse impact.
- The issue of the safety of the reactor must be obvious to both the regulators and the public.
- The reactor should be simple to operate, upgrade and maintain for limited staff with less technical expertise.
- Online capability to perform maintenance and fuel loading.
- The system should ensure a minimal environmental impact.
In this scenario, we consider LOCA fault occurs, and the main symptoms will be revealed. To simulate this fault, a fault block is placed at the reactor hot leg. After a set time, the primary coolant flow in the hot leg is switched from its normal operational value to a reduced value through an SW triggered by a simple step input. The trigger time is 10 sec, which is typical. The primary coolant flow is changed from its average value to a leakage value (70% of the regular primary coolant flow). The resulting symptoms of the LOCA fault are listed in Table
The Loss of Coolant Accident (LOCA) fault in WWER reactor and influenced parameters.
| Case No. | Parameter | Symbol parameter | Steady-state values | Limit values | Symptoms* |
|---|---|---|---|---|---|
| P1 | Pressurizer water level | Lp | 1188 mm | ±38 mm | – |
| P2 | Core coolant average temperature | Tave | 289 °C | ±1 °C | + |
| P3 | Pressurizer pressure | Pp | 15.5 MPa | ±69 kPa | – |
| P4 | Steam generator pressure | Psg | 5.2 MPa | ±15.5 kPa | + |
| P5 | Steam generator steam flow | Wstm | 26.15 kg/s | ±4.5 kg/s | – |
| P6 | Steam generator water level | Lsg | 3200 mm | ±255 mm | – |
| P7 | Condensate receiver water level | Lcr | 2337 mm | ±76 mm | + |
| P8 | Feedwater pressure | Pfw | 8.7 MP | ±20.68 kPa | + |
| P9 | Feedwater flow | Wfw | 25.85 kg/s | ±4.5 kg/s | – |
| P10 | Feedwater temperature | Tfw | 212 °C | ±0.55 °C | + |
The sequence of main events after LOCA and time.
| Sequence event | Time (s) |
|---|---|
| Start of the double-ended break in cold leg | 0.0 |
| Station blackout | 0.0 |
| Start of the reactor scram | 0.0 |
| HPSI signal (Pressure in UP<10.9 MPa) | 0.113 |
| Flashing begins in UP | 0.9 |
| First PCT (1032 °C) | 5.72 |
| Start of hydroaccumulators | 7.02 |
| Primary pressure below secondary pressure | 7.4 |
| Cladding broken in mesh 21 | 8.15 |
| Complete closing of steam discharge valve | 10.0 |
| Complete closing of feedwater valve | 10.0 |
| Pressurizer empty | 14.1 |
| LPSI signal at 2.5 MPa | 14.18 |
| HPSI0LPSI start (delay of 40 s for DG start after loss of offsite power) | 40.0 |
| End of hydroaccumulator injection | 88.4 |
| End of calculation | 120.0 |
2.4 Weight coefficient
Suppose a labelled training set ϕ including ρ member, that each member (x(t), v(t))∈ϕ corresponding to a time value. The vector x(t) is the vector of the observed variables at t and v(t)=[v1(t),..,vm(t)], where vj(t)=µωj x(t), contains the correct membership values of x(t) to each fault class. Corresponding to each x(t) as input, the diagnostic system output is the vector y(t)=[y1(t),..,ym(t)]. The discussed v(t) as output able to written from the y(t) as output:
V(t) = y(t) + ɛ(t) (2)
where is the error in output calculation. The classifier’s parameters are calculated by optimizing the output error. Generally, the quadratic output error function is adopted, which is computed as (
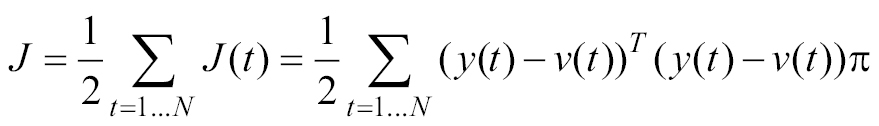 , (3)
, (3)
where J(t) is the error function at time t, and the superscript T denotes the transpose.
3. Results and discussion
According to the defined scenario of WWER-NPP in the fault LOCA, the output response of the weight and the bias values are calculated using MATLAB toolboxes. The Bias Matrix elements resulted from MATLAB toolboxes were shown in Table
The Bias Matrix elements in NFDS and GA.
| Case No. | NFDS | GA |
|---|---|---|
| P1 | 0.8427 | 2.3815 |
| P2 | -1.7108 | 1.5001 |
| P3 | -2.8814 | 0.0012 |
| P4 | 0.7201 | -3.8142 |
| P5 | 0.2563 | 4.7713 |
| P6 | -2.4180 | 0.1843 |
| P7 | 1.7124 | -0.1054 |
| P8 | 1.4581 | 0.0284 |
| P9 | -2.4001 | 0.0214 |
| P10 | -0.8022 | 2.4710 |
The NFDS output and GA output for LOCA fault case.
| Case No. | NFDS Output | GA Output |
|---|---|---|
| P1 | 0.0104 | 0.0004 |
| P2 | 0.8424 | 0.8918 |
| P3 | 0.9169 | 0.9915 |
| P4 | 0.0387 | 0.0010 |
| P5 | 0.0001 | 0.0000 |
| P6 | 0.2894 | 0.0412 |
| P7 | 0.0831 | 0.0001 |
| P8 | 0.0011 | 0.0098 |
| P9 | 0.0092 | 0.0172 |
| P10 | 0.0001 | 0.0241 |
The bias data rang for NFDS and GA approaches are (-2.8814 to 1.7124) and (-3.8142 to 4.7713), respectively. This means that the constructed neural network by GA is wider than NFDS. So, GA approaches is better than NFDS for the LOCA reactor accidents data. The results correspondence to weights and biases values proves the output.
The calculated weights and biases values of P3 and P2 are 0.9169 (with NFDS method), 0.9915 (with GA method); and 0.8424 (with NFDS method), 0.8918 (with GA method), respectively. The appearance of symptoms in GA and NFDS approaches are shown in Fig.

4. Conclusion
In this research, a general framework of soft computing techniques for the NPP safety investigation is proposed, for this purpose, the support system based on Neuro-Fuzzy Diagnosis System (NFDs) method and Genetic Algorithms (GAs) approach were used. Hence, the LOCA fault of WWER nuclear power reactor was defined as a critical scenario. The weight and the bias values of NFDS and GA were calculated using MATLAB toolboxes.
In this scenario, we accomplished a GA approaches which can create the high-performance neural network structure for a given input data and the corresponding target accident such as LOCA fault. The LOCA fault appearance is recognized with ten common symptoms. The obtained result showed that the first symptom is P3 (pressurizer pressure) and second order symptom is P2 (core coolant average temperature) in both approaches. The comparison between the NFDs method and the GAs approaches indicated that the GAs in data test results was faster than the NFDs results.
An essential contribution of this work is the ability of the output results to represent qualitatively in real time. In other words, in an intelligent interface, the symptoms and the fault relationship, allowing human experts to understand, validate classifier results and acceptable decision.
Acknowledgements
This work is financially supported by the Near East University (NEU) and the University of Kyrenia of TRNC.
References
- Abbasi A (2018) Analysis of uranium oxide fuel transmutation in VVER-1000 reactor using VISTA and WIMS-D4 codes. Nuclear Engineering and Design 328: 115–120. https://doi.org/10.1016/j.nucengdes.2018.01.005
- Al-Dahidi S, Di Maio F, Baraldi P, Zio E (2016) Remaining useful life estimation in heterogeneous fleets working under variable operating conditions. Reliability Engineering & System Safety 156: 109–124. https://doi.org/10.1016/j.ress.2016.07.019
- Ayoobian N, Mohsendokht M (2016) Multi-objective optimization of maintenance programs in nuclear power plants using Genetic Algorithm and Sensitivity Index decision making. Annals of Nuclear Energy 88: 95–99. https://doi.org/10.1016/j.anucene.2015.10.033
- Carelli MD, Conway LE, Oriani L, Petrović B, Lombardi CV, Ricotti ME, Barroso ACO, Collado JM, Cinotti L, Todreas NE, Grgić D (2004) The design and safety features of the IRIS reactor. Nuclear Engineering and Design 230(1): 151–167. https://doi.org/10.1016/j.nucengdes.2003.11.022
- Coban R (2010) Computational intelligence-based trajectory scheduling for control of nuclear research reactors. Progress in Nuclear Energy 52(4): 415–424. https://doi.org/10.1016/j.pnucene.2009.09.004
- Dorin-Mirel S, Robert ŞG (2015) Trends in computational intelligence applied in nuclear engineering and non-destructive examination techniques of nuclear units. Electronics, Computers and Artificial Intelligence (ECAI), 2015 7th International Conference, Y-33 pp. https://doi.org/10.1109/ECAI.2015.7301174
- Evsukoff A, Gentil S (2005) Recurrent neuro-fuzzy system for fault detection and isolation in nuclear reactors. Advanced Engineering Informatics 19(1): 55–66. https://doi.org/10.1016/j.aei.2005.01.009
- Fuller R (2000) Introduction to Neuro-Fuzzy Systems. Advances in Soft Computing Series, Springer-Verlag, Berlin/Heildelberg. https://doi.org/10.1007/978-3-7908-1852-9_1
- Hines JW, Uhrig RE (2005) Trends in computational intelligence in nuclear engineering. Progress in nuclear energy 46(3–4): 167–175. https://doi.org/10.1016/j.pnucene.2005.03.002
- Hu W, Liu B, Ouyang X, Tu J, Liu F, Huang L, Fu J, Meng H (2015) Minor actinide transmutation on PWR burnable poison rods. Annals of Nuclear Energy 77: 74–82. https://doi.org/10.1016/j.anucene.2014.10.036
- Isermann R (1997) Supervision, fault-detection and fault-diagnosis methods – an introduction. Control engineering practice 5(5): 639–652. https://doi.org/10.1016/S0967-0661(97)00046-4
- Kumar A, Tsvetkov PV (2015) A new approach to nuclear reactor design optimization using genetic algorithms and regression analysis. Annals of Nuclear Energy 85: 27–35. https://doi.org/10.1016/j.anucene.2015.04.028
- Mirekhtiary SF, Abbasi A (2018) Uranium oxide fuel cycle analysis in VVER-1000 with VISTA simulation code. AIP Conference Proceedings. AIP Publishing 1935(1): 100005. https://doi.org/10.1063/1.5025993
- Muzzammil MSM, Ali EM (2013) Safety improvement of nuclear power reactor using soft computing techniques. In: Energy Efficient Technologies for Sustainability (ICEETS), 2013 International Conference, 949–954. https://doi.org/10.1109/ICEETS.2013.6533515
- Ruan D (2013) Fuzzy systems and soft computing in nuclear engineering. Physica 38.
- Saber AS, El-Koliel MS, El-Rashidy MA, Taha TE (2015) December. Nuclear reactors safety core parameters prediction using Artificial Neural Networks. Computer Engineering Conference (ICENCO), 2015 11th International, 163–168. https://doi.org/10.1109/ICENCO.2015.7416342
- Sabotinov L, Srivastava A (2010) Large Break Loss-of-Coolant Accident Analysis of VVER-1000 Reactor Using CATHARE Code. Nuclear Technology 170(1): 123–132. https://doi.org/10.13182/NT10-A9451
- Wang C, Yan C, Wang J, Tian C, Yu S (2017) Parametric Optimization of Steam Cycle in PWR Nuclear Power Plant Using Improved Genetic-simplex Algorithm. Applied Thermal Engineering. https://doi.org/10.1016/j.applthermaleng.2017.07.045
- Zio E, Gola G (2006) Neuro-fuzzy pattern classification for fault diagnosis in nuclear components. Annals of Nuclear Energy 33(5): 415–426. https://doi.org/10.1016/j.anucene.2005.12.008