|
||
|
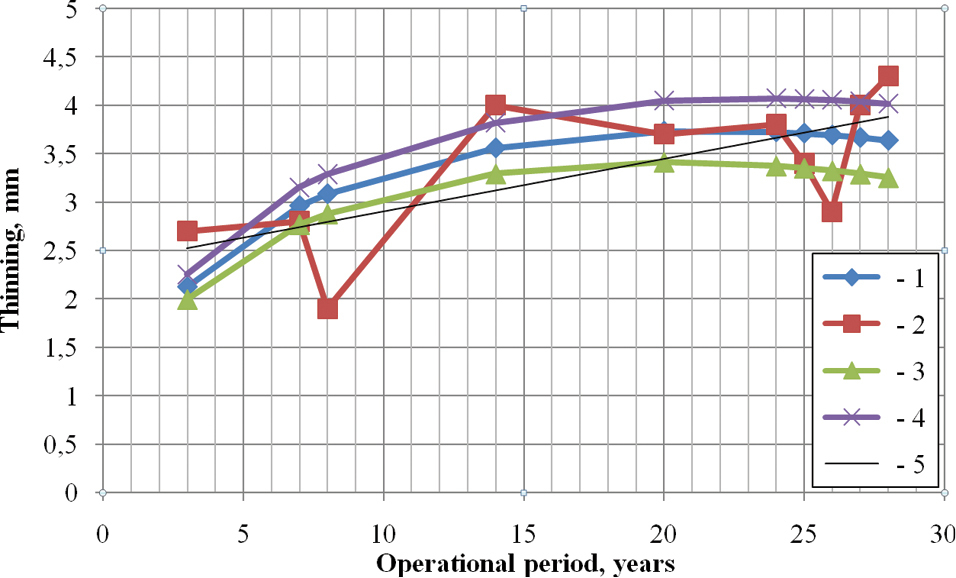
Correspondence between the control and forecast values for the approximated Keller coefficient (feedwater pipeline): 1 – forecast; 2 – control; 3 – –∆; 4 – +∆; 5 – regression (y = 0.054x + 2.361; R2 = 0.459). |
|
||||||||
| Part of: Baranenko VI, Gulina OM, Mironov SA, Salnikov NL (2020) Repeated measurements and quality of estimates in the analysis of NPP pipeline erosion-corrosion wear. Nuclear Energy and Technology 6(4): 281-287. https://doi.org/10.3897/nucet.6.60459 |