|
||
|
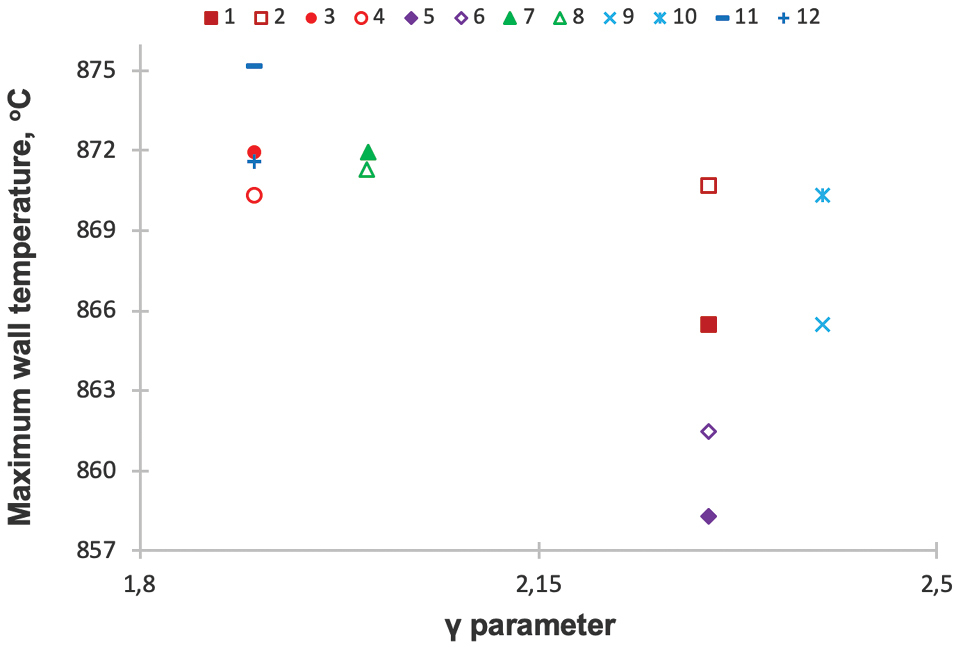
Comparison of Qwallimaxс, values obtained by direct calculation of the coolant mass flow distribution (Р) and the CFD-simulation results (М): 1 – М, channels with ϕ = 15.88 mm, the central core area, shaping at ΔTi = idem; 2 – Р, channels with ϕ = 15.88 mm, the central core area, shaping at ΔTi = idem; 3 – М, channels with ϕ = 15.88 mm, the peripheral core area, shaping at ΔTi = idem; 4 – Р, channels with ϕ = 15.88 mm, the peripheral core area, shaping at ΔTi = idem; 5 – М, channels with ϕ = 12.7 mm, the peripheral core area, shaping at ΔTi = idem; 6 – Р, channels with ϕ = 12.7 mm, the peripheral core area, shaping at ΔTi = idem; 7 – М, channels with ϕ = 15.88 mm, the central core area, shaping at Qwallimax = idem; 8 – Р, channels with ϕ = 15.88 mm, the central core area, shaping at Qwallimax = idem; 9 – М, channels with ϕ = 15.88 mm, the peripheral core area, shaping at Qwallimax = idem; 10 – Р, channels with ϕ = 15.88 mm. the peripheral core area, shaping at Qwallimax = idem; 11 – М, channels with ϕ = 12.7 mm, the peripheral core area, shaping at Qwallimax = idem; 12 – Р, channels with ϕ = 12.7 mm, the peripheral core area, shaping at Qwallimax = idem. |