|
||
|
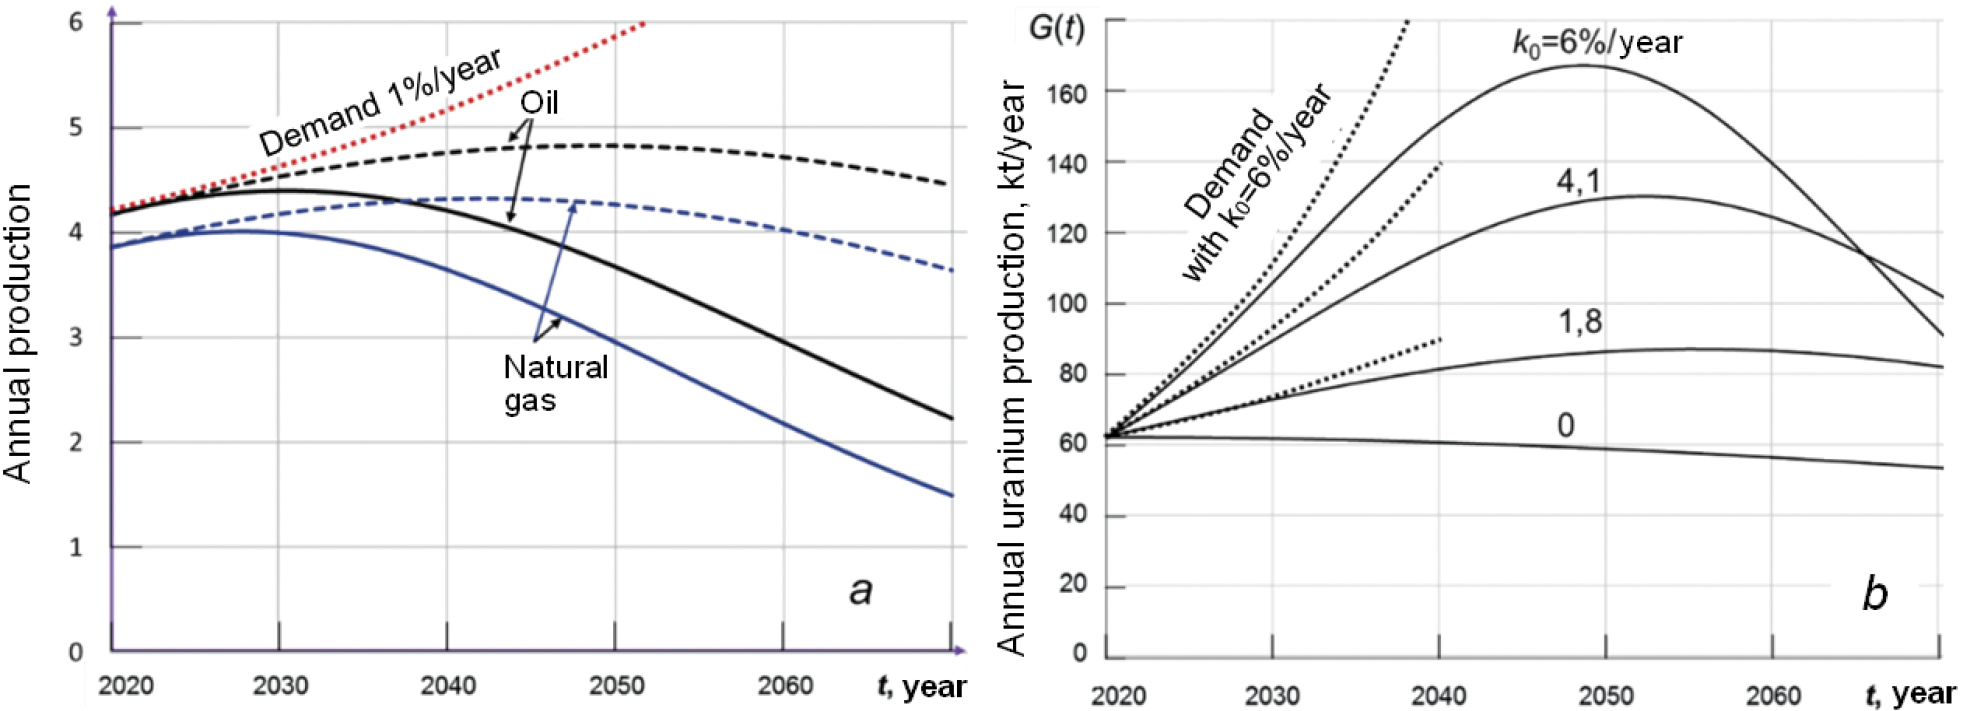
Dynamics of the annual oil and natural gas production worldwide (109 t/year and 1012 m3/year respectively) with the initial rate of production growth rate being k0=1%/year with initial data shown in Table 3 (a), and the annual uranium production for different evolution scenarios of nuclear power based on thermal reactors (b). The dashed lines in (a) are for the doubled oil and natural gas resources, and the dotted lines are for the oil demand with a rate of 1%/year (a) and the uranium demand according to three WNA-23 scenarios (The Nuclear Fuel Report 2023) (b). |